Revista Veterinaria. 2026; 37(1)
https://doi.org/10.30972/vet.3719106
Comunicación breve


A. Arauz1,a
Á. Santana1,b
J Morales1,c
A. De Sedas2,d
Y. Añino3,4,e
K. Agrazal3,f
E. Romero5,g
1Facultad de Medicina Veterinaria, Universidad de Panamá, Ciudad de Panamá, Panamá.
2Departamento de Estadística, Facultad de Ciencias Naturales Exactas y Tecnología, Universidad de Panamá, Ciudad de Panamá, Panamá.
3Museo de Invertebrados G.B. Fairchild, Universidad de Panamá, Ciudad de Panamá, Panamá.
4Estación Científica Coiba (COIBA AIP), Clayton, Panamá.
55Departamento de Fisiología y Comportamiento Animal, Facultad de Ciencias Naturales Exactas y Tecnología, Universidad de Panamá, Ciudad de Panamá, Panamá.
Recibido: 28 julio 2025 / Aceptado: 24 octubre 2025
Abstract
Accurate sample size estimation is essential in prevalence studies to ensure statistically valid conclusions and efficient resource allocation. This technical note presents an approach for estimating sample size in prevalence studies of Anaplasma phagocytophilum in equines. A preliminary PCR-based survey in Panama detected one positive case among 36 animals (2.78%). Based on these results, expected prevalences of 2%, 3%, 8%, and 9% were used to model future sample sizes using the ScalaR function in R, incorporating absolute precisions (± 0.75%, ± 1.5%, ± 2%) and a 10% adjustment for potential data loss. The estimated sample sizes ranged from 233 (2% prevalence, ± 1.9%) to 6,216 animals (9% prevalence, ± 0.75%). These findings illustrate how minor variations in assumed prevalence or desired precision can substantially influence the sample size required for reliable epidemiological surveillance.
Key words: Prevalence studies, Precision, Sample size, ScalaR.
Resumen. La estimación precisa del tamaño de la muestra es esencial en los estudios de prevalencia para garantizar conclusiones estadísticamente válidas y un uso eficiente de los recursos. Esta nota técnica presenta un enfoque de estimación del tamaño de la muestra para estudios de prevalencia de Anaplasma phagocytophilum en equinos. Un estudio preliminar basado en PCR en Panamá arrojó un caso positivo entre 36 animales (2,78%). Con base en esto, se utilizaron prevalencias esperadas del 2%, 3%, 8% y 9% para modelar futuros tamaños de muestra mediante la función ScalaR en R, incorporando precisiones absolutas (± 0,75%, ± 1,5%, ± 2%) y un ajuste por pérdida de datos del 10%. Los tamaños de muestra estimados oscilaron entre 233 (prevalencia del 2%, ± 1,9%) y 6.216 animales (prevalencia del 9%, ± 0,75%). Estas estimaciones destacan cómo pequeños cambios en los supuestos de precisión y prevalencia pueden afectar considerablemente el tamaño de muestra requerido para estudios de vigilancia fiables.
Palabras clave: estudios de prevalencia, precisión, tamaño de muestra, ScalaR.
Hemoparasitic infections represent a significant threat to equine health in tropical and subtropical regions, with both veterinary and zoonotic implications. Among the pathogens involved is Anaplasma phagocytophilum, a Gram-negative intracellular bacterium with tropism for phagocytic cells, capable of evading the host immune response (Rikihisa et al. 2010, Zhang et al. 2025). This pathogen, the causative agent of granulocytic anaplasmosis, is of growing interest in both human and veterinary medicine. Its transmission is primarily associated with the Ixodes persulcatus tick complex, although other genera such as Dermacentor and Hyalomma have also been implicated as vectors (Dugat et al. 2015, Vimonish et al. 2020, Choubdar et al. 2021).
In Panama, there is growing interest in understanding the distribution of this agent. Although the presence of A. phagocytophilum has been confirmed in ticks collected in wild areas of the country (Bermúdez et al. 2021), studies on its impact on domestic equines are scarce. Despite molecular technology, no systematic research has been conducted to assess its prevalence in horses using PCR; this is essential to strengthen surveillance of vector-borne diseases in horses, including anaplasmosis (OIRSA 2018).
Furthermore, equine anaplasmosis can present with clinical signs like those of other hemoparasitic infections, such as piroplasmosis, which complicates clinical diagnosis and highlights the need for the use of molecular tools such as PCR for a reliable differential diagnosis (Courtney et al. 2004, Schäfer et al. 2023). In this context, we initially conducted a preliminary evaluation of A. phagocytophilum by PCR in horses from three districts of Los Santos province. The detection of a single positive case among 36 animals suggests a low apparent prevalence; however, the limited sample size restricts the ability to obtain accurate and generalizable estimates.
Incorrect sample size calculation could introduce statistical errors leading to inaccurate results, which are critical, particularly in medical science research (Pourhoseingholi et al. 2013, Serdar et al. 2021). Given this limitation, this study aims to estimate the appropriate sample size for this type of prevalence study. Exploring essential parameters such as expected prevalence, absolute precision, and anticipated data loss are crucial to facilitate the design of studies with greater statistical validity and epidemiological utility. Integrating these approaches will guide future equine health surveillance efforts on a solid methodological foundation.
A preliminary study was conducted using 36 equine blood samples, which were collected by a licensed veterinarian from farms in the Los Santos region of Panama, following approval by the thesis committee of the Veterinary School.
The samples were analyzed by conventional PCR for the detection of A. phagocytophilum, obtaining a single positive case (1/36), which corresponds to a low apparent prevalence of 2.78%. Based on this finding, sample size estimation scenarios were evaluated using expected prevalences of 2%, 3%, 8%, and 9%. These values reflect both the preliminary result and similar prevalences reported in regional studies across South America, where low prevalences (<10%) have been documented using immunofluorescence or PCR (Rodríguez Jorquera and Conejeros Ortiz 2013, Párraga et al. 2016, Prado et al. 2018).
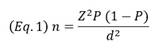
The sample size was calculated using the classic formula (Eq. 1) for estimating proportions in large populations (Pourhoseingholi et al. 2013). Where P represents the expected prevalence, d the absolute precision, and Z the critical value for a 95% confidence interval (Z = 1.96). The term absolute precision is also known as margin of error.
Sample size estimations were performed using the ScalaR (Naing et al. 2022) function in R. This tool allows users to define the relevant parameters and incorporate an adjustment for an anticipated 10% data loss, commonly associated with invalid samples. Since all evaluated prevalences were below 10%, absolute precision values were selected in accordance with this epidemiological context. Based on methodological recommendations, absolute precision of ± 0.75%, ± 1.5%, and ± 2% were applied for each expected prevalence value. Narrow precision is crucial at low prevalence levels, as wider margins can produce uninformative confidence intervals that include zero or exceed the estimate.
It is worth noting that a precision of ± 2% was not used for the expected prevalence of 2%, as this would result in a confidence interval ranging from 0% to 4%. This would allow for an estimate so wide that it would include the complete absence of infection. As this would compromise the usefulness of the analysis and contradict methodological recommendations (Naing et al. 2022), a slightly narrower precision of ± 1.9% was selected instead. This ensures a more informative and statistically valid confidence interval. The results are presented as the calculated value of sample size (± precision).
The required sample size varied depending on the expected prevalence, the type of study, and the level of precision. For a prevalence of 2%, sample sizes ranged from 233 (± 1.9%) to 1488 (± 0.75%). For a prevalence of 3%, between 312 and 2,209 individuals would be required, while for higher prevalences such as 8% and 9%, sample sizes increased from 786 to 6216. The higher the precision, the larger the required sample size (Table 1, Figure 1A). Confidence intervals narrowed with increasing precision. For example, at a prevalence of 9%, a precision of ± 2% yielded a CI of 7-11%, while ± 0.75% narrowed it to 8.25-9.75% (Figure 1B).
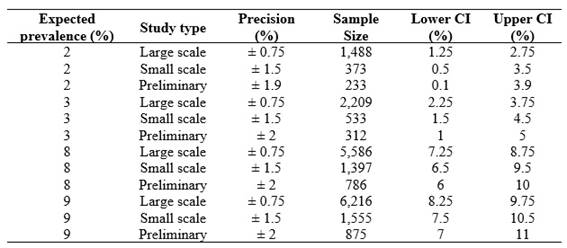
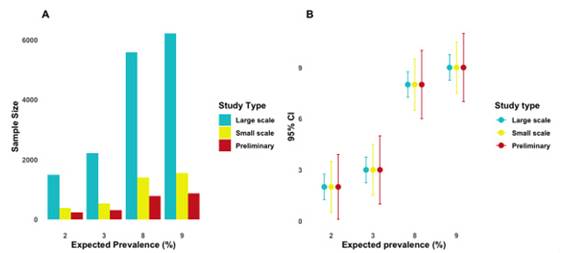
As the absolute precision increases (i.e., the numerical value of the margin of error decreases), the required sample size grows significantly for all prevalences evaluated. This is especially evident at high prevalence (8% and 9%), where moving from a precision of ± 2% to ± 0.75% implies a sample increase of more than 5,000 individuals. For low prevalences such as 2% and 3%, the growth is also notable, but more moderate in absolute terms. For example, for a 2% prevalence, the sample size increases from approximately 233 (± 1.9%) to 1,488 (± 0.75%).
The results show that, when working with prevalence below 10%, it is necessary to adopt strict levels of absolute precision (± 0.75% to ± 2%) to avoid overly wide or methodologically invalid confidence intervals. This was especially relevant for the 2% prevalence, where a precision of ± 2% would have produced a lower interval that was not very informative.
Furthermore, it is noteworthy that the relationship between precision and sample size is not linear; small increases in precision imply substantial increases in the number of subjects required, which can compromise the operational feasibility of the studies. Therefore, the early use of sample calculation tools contributes to the efficient planning of future research, especially in settings with limited resources or low prevalence rates.
The classical sample size formula, used to estimate individual proportions in descriptive studies, does not consider statistical power and implicitly assumes a value close to 50%, sufficient for estimation but limited for comparative analyses. Statistical power -the probability of correctly rejecting a false null hypothesis (1 - β)- is typically set at 80% (Abdallah 2024). This can be addressed using the equation for comparing two proportions (Eq. 2).
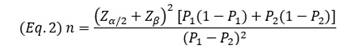
This approach is applied in studies comparing proportions between groups. Sample size requirements for various hypothetical comparisons (e.g., 3% vs. 9%, 3% vs. 8%, 8% vs. 9%) were estimated using 80% power and a 5% significance level. As expected, smaller differences in prevalence required much larger sample sizes, ranging from 490 (3% vs. 9%) to 651 (8% vs. 3%) and 24,416 (8% vs. 9%).
These calculations expand the applicability of this note, offering a general framework for prevalence estimation and comparative study design across species and contexts.
According to our experimental approach, an apparent prevalence of 2.72% was estimated from 36 animals sampled in Panama. To obtain a more robust estimate on a national scale, it is recommended to use an expected prevalence of 3% with a precision of ±0.75%, which would require a minimum sample size of 2,209 horses. This approach represents the optimal scenario from a statistical standpoint. However, if the costs associated with molecular testing (PCR) are high and available resources are limited, an intermediate approach may be considered. In this case, using a precision of ± 1.5% with the same estimated prevalence would reduce the sample size to 533 animals, maintaining a reasonable balance between methodological rigor and operational feasibility.
Proper sample planning is key to ensuring reliable prevalence estimates. Tools like ScalaR allow for informed decisions based on objectives, expected prevalence, and available resources. Early use optimizes the efficiency and impact of epidemiological studies in veterinary medicine. ScalaR estimates sample sizes for single-proportion studies with specified confidence and precision. However, when the goal is to compare proportions between groups, statistical power and effect size must be considered.
Acknowledgment. DSA, YA, and ER thank the "Convocatoria de Movilidad Internacional" (Economic Subsidy Contract SENACYT-DDCCT No. 002-2025) for promoting collaboration on this project's data analysis.
CRediT authorship contribution statement. Conceptualization: RE. Methodology: RE, AA, SÁ, MJ, DSA. Investigation: AA, SÁ, MJ, DSA, AY, AK, RE. Data Curation: AY, RE. Formal Analysis: RE. Supervision: AY, RE. Writing – Original Draft: RE, AA. Writing – Review & Editing: All authors
Declaration of competing interest. The authors declare that they have no known competing financial interests or personal relationships that could have appeared to influence the work reported in this paper.
Data availability. Data will be made available on request.
